


Injector Flow vs Pump Flow
Thread Starter
I need a gauge for that
iTrader: (37)
Joined: Jan 2006
Posts: 10,921
Likes: 3
From: Huntsville, AL
I've had this posted on performancetrucks.net for a while now and thought I would share it over here. Figured some of you guys would find it useful.
I was thinking about my track outing last weekend and was pondering over why I was so out of fuel with huge injectors, and then the realization set in that pump flow decreased much faster than injector flow increased with pressure. My suspicion was raising the base fuel pressure actually hurt me in terms of total fuel system flow.
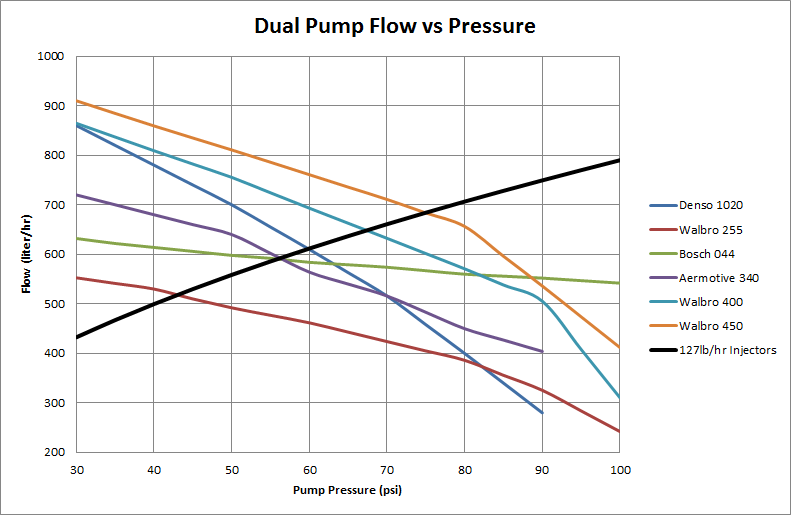
I made this spreadsheet comparing the flow rates of the most common fuel pumps in single and dual configurations; walbro 255, walbro 400, walbro 450, aeromotive 340, bosch 044, and denso 1020 (my current pumps). I found all of these flow rates on the internet and interpolated for values I didn�t have to have for adequate chart resolution. I attached the spreadsheet to this post, but for the lazy ones among us I am posting a graph for discussion. I used my current 127lb/hr @4bar injectors as comparison.
To use this spreadsheet on your own setup, simply download it and change the green box to whatever your injectors are rated at 4bar. The pump flows will not change. The spreadsheet provides a nice compilation of these as well.
Assumptions
This analysis makes a few assumptions. Namely, the fuel lines, and rails are of adequate size to not cause an appreciable flow restriction (and therefor pressure drop). The voltage to the pumps is constant at 13.5v. In dual pump configurations, there is a doubling of flow. 1 US gallon=3.7854 liters, and 1lb of gasoline weighs 6.073 pounds. The injectors operate at a maximum of 95% duty cycle. Gasoline is the only fuel being used (although an e85 analysis is similar, not all pumps are e85 rated).
The thing to keep in mind is that the fuel system upper bound is determined by the least flowing component (pumps or injectors). Basically the injectors can�t flow more fuel than they are given by the pumps and the pumps don�t need to pump more fuel to the injectors than can be used.
Notice the black line, which is the flow rate of my injectors with respect to rail pressure. At some point it crosses all of the pump curves. It is at this intersection (to a given pump) where the injectors are using the exact amount of fuel the pumps are providing. There will be nothing returned to the tank no pressure drop at the rail at this point. To the left of this intersection there is more pump flow than injector flow, so some fuel will be returned. Similarly to the right of this point there is a lack of pump flow so rail pressure drops (which moves the pumps back to the left so they flow more).
To clarify, it is impossible to operate to the right of the intersection point since the injectors cannot flow more than the pumps. If it were on the right, the pumps would see less pressure and move to the left on their curves, where they flow more, and rebalance with the injectors. When your desired flow rate is to the right or above the intersection, the air/fuel ratio will be lean. The further away, the leaner you will be.
With larger injectors, the black line will shift upward (and obviously smaller injectors force it down). The important thing here is the intersection point. The intersection point is your maximum fuel system flow capacity. With more powerful pumps or higher voltage (boost-a-pump) the pump curves are shifted upward. The higher this intersection on the vertical axis the more power your fuel system can support.
Boost and Base Fuel Pressure
The second topic I want to talk about is boost. If you are boosted you need to be using a boost reference regulator, this will increase fuel rail pressure to compensate for boost. Notice how the pump curves decline with pressure, this is why FI needs a lot of fuel pump. With a boost referenced regulator, pressure is maintained at a constant at the fuel injector, so the injector line would be flat while the pump slopes down. It is the same conceptually, where these lines cross is your maximum fuel flow.
Reading the Graph
To use my spreadsheet, we can look at the above graph. Let�s say you have dual walbro 255s and 127lb injectors and want to run a max of 20psi of boost. The question is what is the best base pressure to use? You want this to be high enough so the injectors flow enough at idle to have good control, but low enough so you don�t max out the pumps before the injectors. How you would do this is a little tricky. You want the curves of your injectors and pumps to be separated by your max boost pressure, 20psi in my example. Because injector rail pressure is held constant, injector flow will be a flat horizontal line instead of the sloped one on the chart. So going back to my example of dual 255s, if you draw a line straight up from 58psi to the injector curve, and move 20psi to the right, where is the pump curve? It is far below the injector line, meaning our system is very pump limited. If you draw a line straight up from 35psi to the injector curve and move 20psi to the right it will hit dead even to the walbro pump curve. This means the ideal base pressure for the combination of dual walbro 255s and 127lb injectors is a 35psi base pressure. If we repeat the same process for dual walbro 400s, we find 55psi to be the ideal base pressure.
With larger injectors or smaller pumps the ideal base point is to the left, and with smaller injectors or larger pumps the ideal base point is further right. If base pressure is too high with large injectors, they will have a difficult time idling due to their minimum pulse width.
Case In Point
Lets take the case of my truck last weekend; I was running dual denso 1020s at a 70psi base and 20psi boost. If you see the chart, the means my injectors could potentially flow 650l/hr but I was pump limited to closer to 270l/hr. Which perfectly explains why adding fuel in the tune did absolutely nothing! Remember your fuel system is defined by the lower limit. If I had run a 50psi base, my injectors would only flow about 560l/hr but my pumps would flow 525l/hr. That is nearly double my total fuel system capacity at 70psi base! If I had done this analysis before last weekend I would have gotten my 9 second pass almost certainly.
Lower and Upper Limits to Boost Pressure
I talked about the upper limit in terms of becoming pump or injector limited, but the lower limit is a bit harder. As the engine speed increases, you have less time to inject enough fuel by the relation "injection time(ms)=120/RPM" in terms of miliseconds. To find a true lower limit, you would need to know your required fuel amount and at what rpm. Obviously with a higher desired rpm you want a higher base pressure. Furthermore, it becomes clear to make high-rpm, high-boost power you need massive pumps and massive injectors to support a high base pressure!
Conclusion
I have not seen a discussion on this before regarding pump flow and injector flow, but the analysis is surprising simple and extremely relevant. I encourage people to download the spreadsheet and play with the injector sizing to see what size injectors you will need to support the pumps you plan on going with to support the power you want to make. Fuel system flow can be related to power output by knowing your BSFC.
The main thing to take away here is running a higher base pressure does not mean you will make more power, and I was actually surprised how quickly pump flow falls off after doing this analysis.
Additional pumps (some of the big magnafuels for example) can be easily added and examined in the same way.
I plotted fuel flow against power produced using a BFSC of 0.7, which I think is a good estimate for these trucks. How you would use this is to find at what fuel flow your pump and injectors are equalized with whatever boost you are using (that flat line you draw from the injector line to the pump line, extend it all the way to the left to find fuel system flow), and look up what power level that corresponds to on this chart:
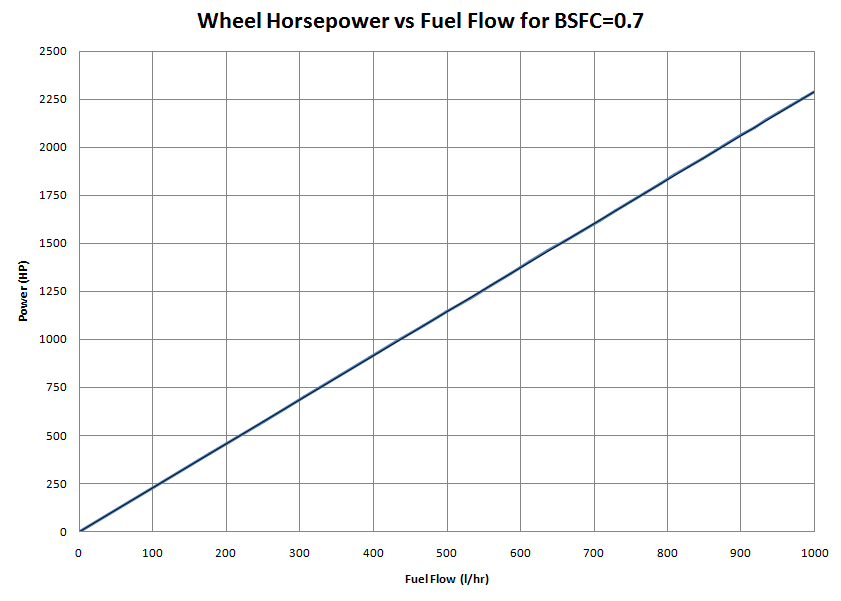
This is wheel horse power and assuming a BSFC of 0.7. This tells you what your fuel system is capable of supporting based on what you find from the right chart in the spreadsheet.
Hope this helps everyone
I was thinking about my track outing last weekend and was pondering over why I was so out of fuel with huge injectors, and then the realization set in that pump flow decreased much faster than injector flow increased with pressure. My suspicion was raising the base fuel pressure actually hurt me in terms of total fuel system flow.
I made this spreadsheet comparing the flow rates of the most common fuel pumps in single and dual configurations; walbro 255, walbro 400, walbro 450, aeromotive 340, bosch 044, and denso 1020 (my current pumps). I found all of these flow rates on the internet and interpolated for values I didn�t have to have for adequate chart resolution. I attached the spreadsheet to this post, but for the lazy ones among us I am posting a graph for discussion. I used my current 127lb/hr @4bar injectors as comparison.
To use this spreadsheet on your own setup, simply download it and change the green box to whatever your injectors are rated at 4bar. The pump flows will not change. The spreadsheet provides a nice compilation of these as well.
Assumptions
This analysis makes a few assumptions. Namely, the fuel lines, and rails are of adequate size to not cause an appreciable flow restriction (and therefor pressure drop). The voltage to the pumps is constant at 13.5v. In dual pump configurations, there is a doubling of flow. 1 US gallon=3.7854 liters, and 1lb of gasoline weighs 6.073 pounds. The injectors operate at a maximum of 95% duty cycle. Gasoline is the only fuel being used (although an e85 analysis is similar, not all pumps are e85 rated).
The thing to keep in mind is that the fuel system upper bound is determined by the least flowing component (pumps or injectors). Basically the injectors can�t flow more fuel than they are given by the pumps and the pumps don�t need to pump more fuel to the injectors than can be used.
Notice the black line, which is the flow rate of my injectors with respect to rail pressure. At some point it crosses all of the pump curves. It is at this intersection (to a given pump) where the injectors are using the exact amount of fuel the pumps are providing. There will be nothing returned to the tank no pressure drop at the rail at this point. To the left of this intersection there is more pump flow than injector flow, so some fuel will be returned. Similarly to the right of this point there is a lack of pump flow so rail pressure drops (which moves the pumps back to the left so they flow more).
To clarify, it is impossible to operate to the right of the intersection point since the injectors cannot flow more than the pumps. If it were on the right, the pumps would see less pressure and move to the left on their curves, where they flow more, and rebalance with the injectors. When your desired flow rate is to the right or above the intersection, the air/fuel ratio will be lean. The further away, the leaner you will be.
With larger injectors, the black line will shift upward (and obviously smaller injectors force it down). The important thing here is the intersection point. The intersection point is your maximum fuel system flow capacity. With more powerful pumps or higher voltage (boost-a-pump) the pump curves are shifted upward. The higher this intersection on the vertical axis the more power your fuel system can support.
Boost and Base Fuel Pressure
The second topic I want to talk about is boost. If you are boosted you need to be using a boost reference regulator, this will increase fuel rail pressure to compensate for boost. Notice how the pump curves decline with pressure, this is why FI needs a lot of fuel pump. With a boost referenced regulator, pressure is maintained at a constant at the fuel injector, so the injector line would be flat while the pump slopes down. It is the same conceptually, where these lines cross is your maximum fuel flow.
Reading the Graph
To use my spreadsheet, we can look at the above graph. Let�s say you have dual walbro 255s and 127lb injectors and want to run a max of 20psi of boost. The question is what is the best base pressure to use? You want this to be high enough so the injectors flow enough at idle to have good control, but low enough so you don�t max out the pumps before the injectors. How you would do this is a little tricky. You want the curves of your injectors and pumps to be separated by your max boost pressure, 20psi in my example. Because injector rail pressure is held constant, injector flow will be a flat horizontal line instead of the sloped one on the chart. So going back to my example of dual 255s, if you draw a line straight up from 58psi to the injector curve, and move 20psi to the right, where is the pump curve? It is far below the injector line, meaning our system is very pump limited. If you draw a line straight up from 35psi to the injector curve and move 20psi to the right it will hit dead even to the walbro pump curve. This means the ideal base pressure for the combination of dual walbro 255s and 127lb injectors is a 35psi base pressure. If we repeat the same process for dual walbro 400s, we find 55psi to be the ideal base pressure.
With larger injectors or smaller pumps the ideal base point is to the left, and with smaller injectors or larger pumps the ideal base point is further right. If base pressure is too high with large injectors, they will have a difficult time idling due to their minimum pulse width.
Case In Point
Lets take the case of my truck last weekend; I was running dual denso 1020s at a 70psi base and 20psi boost. If you see the chart, the means my injectors could potentially flow 650l/hr but I was pump limited to closer to 270l/hr. Which perfectly explains why adding fuel in the tune did absolutely nothing! Remember your fuel system is defined by the lower limit. If I had run a 50psi base, my injectors would only flow about 560l/hr but my pumps would flow 525l/hr. That is nearly double my total fuel system capacity at 70psi base! If I had done this analysis before last weekend I would have gotten my 9 second pass almost certainly.
Lower and Upper Limits to Boost Pressure
I talked about the upper limit in terms of becoming pump or injector limited, but the lower limit is a bit harder. As the engine speed increases, you have less time to inject enough fuel by the relation "injection time(ms)=120/RPM" in terms of miliseconds. To find a true lower limit, you would need to know your required fuel amount and at what rpm. Obviously with a higher desired rpm you want a higher base pressure. Furthermore, it becomes clear to make high-rpm, high-boost power you need massive pumps and massive injectors to support a high base pressure!
Conclusion
I have not seen a discussion on this before regarding pump flow and injector flow, but the analysis is surprising simple and extremely relevant. I encourage people to download the spreadsheet and play with the injector sizing to see what size injectors you will need to support the pumps you plan on going with to support the power you want to make. Fuel system flow can be related to power output by knowing your BSFC.
The main thing to take away here is running a higher base pressure does not mean you will make more power, and I was actually surprised how quickly pump flow falls off after doing this analysis.
Additional pumps (some of the big magnafuels for example) can be easily added and examined in the same way.
I plotted fuel flow against power produced using a BFSC of 0.7, which I think is a good estimate for these trucks. How you would use this is to find at what fuel flow your pump and injectors are equalized with whatever boost you are using (that flat line you draw from the injector line to the pump line, extend it all the way to the left to find fuel system flow), and look up what power level that corresponds to on this chart:
This is wheel horse power and assuming a BSFC of 0.7. This tells you what your fuel system is capable of supporting based on what you find from the right chart in the spreadsheet.
Hope this helps everyone
Last edited by Atomic; Oct 10, 2014 at 08:54 AM.
Your "Reading the Graph" portion is confusing me. Why are you adding 20psi? Both of your examples of moving 20 to the right aren't even lining up with the injector line and fuel pump flow line for me either. Am I missing something? 58psi plus 20psi is 78psi which is still well below the pump line like you said. 35psi plus 20psi is 55psi and is still below the pump line for the dual walbro 255's.. and you say its even? How so?
Thread Starter
I need a gauge for that
iTrader: (37)
Joined: Jan 2006
Posts: 10,921
Likes: 3
From: Huntsville, AL
The 20psi is just the desired boost I picked. If you want to run 25lbs of boost, then you will move 25psi to the right on the graph. 15lbs of boost, 15psi to the right and so forth.
Are you using the spreadsheet or looking at the picture of the graph above? I am referencing the picture when I explain it, once you get how it works, you can use the spreadsheet and plug in your own info and read it the same way. If you look at the picture and go from 35psi up to the injector flow line (the black one), then move 20psi to the right and draw a line up from 55psi it will hit the walbro 255 curve (red line) almost exactly, right around the 460l/hr mark.
Let me know if that helps
I think I get it now. I understand now what you meant about the horizontal line. Basically you pick a point on the black injector line and add boost psi and need to have it meet and intersect with the pump flow line.
So what about NA guys with stock FPR's since we won't be adding boost psi to the equation?
So what about NA guys with stock FPR's since we won't be adding boost psi to the equation?
Thread Starter
I need a gauge for that
iTrader: (37)
Joined: Jan 2006
Posts: 10,921
Likes: 3
From: Huntsville, AL
Yep, exactly. The injector line is sloped to because injector flow increases with rail pressure.
NA guys will want to run at the pressure where the injector line crosses the pump line...basically same procedure as the FI guys, but add 0psi instead of whatever boost.
For example, using the graph above, 127s and dual 400s will be ~67psi, 127s and dual 255s will be ~44psi.
NA guys will want to run at the pressure where the injector line crosses the pump line...basically same procedure as the FI guys, but add 0psi instead of whatever boost.
For example, using the graph above, 127s and dual 400s will be ~67psi, 127s and dual 255s will be ~44psi.
Since I have a stock non-adjustable fuel pressure regulator how am I supposed to do that? My situation is dual walbro 255's and 65lb injectors. The injector line crosses the pump line at 88psi but the stock system regulates to 58psi. At 58psi the injector line is about 1/3 of the pump line. So basically I will have way more pump than I need? A single walbro 255 couldn't keep up with the power I'm making so I had to go to duals.
Trending Topics
Thread Starter
I need a gauge for that
iTrader: (37)
Joined: Jan 2006
Posts: 10,921
Likes: 3
From: Huntsville, AL
Well, this is really for return setups that do have an adjustable regulator, since the goal is to find your most ideal base pressure. Since you dont have that control, you just have to try and match your injectors to your pumps as best you can.
In your case if you open the spreadsheet and put in your injectors, it looks like your ideal pressure would be close to 84psi, but since thats not an option, and at 58psi you have way more pump than injector. Similiarly for the single pump graph, it crosses at 44psi. So basically with your injectors, one 255 is too small and two is more than you need.
To take full advantage of your pumps, 96lb injectors would be perfect, but thats probably way more than youll ever need NA unless you go with e85, and even then its a lot of injector.
A perfect single pump for you would be a bosch 044 or a denso 1020.
LS1 Tech Stories
The Best V8 Stories One Small Block at Time

Gas Monkey Built a 6-Wheel Ferrari Testarossa With a Corvette LT4 Engine
Verdad Gallardo
7 Most Reliable High-Performance Engines GM Has Ever Built
Verdad Gallardo
Amazing '71 Camaro Restomod Is Modern Muscle Car Under the Skin
Verdad Gallardo
6 Common C5 Corvette Failures and What's Involved In Repairing Them
Pouria Savadkouei
Retro Modern Bandit Pontiac Trans AM Comes With Burt Reynolds' Autograph
Verdad Gallardo
Top 10 Greatest Cadillac V Series Performance Models Ever, Ranked
Pouria Savadkouei
Top 10 Most Powerful Chevy Trucks Ever Made!

Hennessey's New Supercharged Silverado ZR2 Has 700 HP
Verdad Gallardo
Coachbuilt N2A Anteros Is an LS2-Powered C6 Corvette In Italian Clothes
Verdad GallardoWell, this is really for return setups that do have an adjustable regulator, since the goal is to find your most ideal base pressure. Since you dont have that control, you just have to try and match your injectors to your pumps as best you can.
In your case if you open the spreadsheet and put in your injectors, it looks like your ideal pressure would be close to 84psi, but since thats not an option, and at 58psi you have way more pump than injector. Similiarly for the single pump graph, it crosses at 44psi. So basically with your injectors, one 255 is too small and two is more than you need.
To take full advantage of your pumps, 96lb injectors would be perfect, but thats probably way more than youll ever need NA unless you go with e85, and even then its a lot of injector.
A perfect single pump for you would be a bosch 044 or a denso 1020.

On The Tree
Joined: Dec 2011
Posts: 109
Likes: 0
So I downloaded the sheet and changed the number in the green box to 69 for my injectors and it looks like the injector line crosses the dual walbro line right at 80psi. So, say I want to run 16 pounds of boost... the pump and injectors would be equalized at about 64psi base pressure? Is it worth turning up the fuel pressure 6-7 psi? I obviously want to get the most out of what I stuck myself with for now, but is it worth the trouble?

9 Second Club
Joined: Nov 2003
Posts: 13,616
Likes: 185
From: Norn Iron
Dont forget, you must have more pump capacity than you need in order to stand any chance of maintaining fuel pressure. Not all regulators flow the same, or require the same volume of flow through them to maintain pressure.
So you must have an excess of flow, plus what you think you need to achieve any level of HP at the injector.
The graphs are based on theoretical flow, with nothing being returned to the tank. Which in reality could never happen, or if it did start to approach it, could be bad for the engine.
The Bosch pumps steady and consistent flow at all pressures make it a superb all rounder, regardless of some others claiming more flow. The ones that do claim more, also draw huge amounts of current.
Thread Starter
I need a gauge for that
iTrader: (37)
Joined: Jan 2006
Posts: 10,921
Likes: 3
From: Huntsville, AL
So I downloaded the sheet and changed the number in the green box to 69 for my injectors and it looks like the injector line crosses the dual walbro line right at 80psi. So, say I want to run 16 pounds of boost... the pump and injectors would be equalized at about 64psi base pressure? Is it worth turning up the fuel pressure 6-7 psi? I obviously want to get the most out of what I stuck myself with for now, but is it worth the trouble?
Dont forget, you must have more pump capacity than you need in order to stand any chance of maintaining fuel pressure. Not all regulators flow the same, or require the same volume of flow through them to maintain pressure.
So you must have an excess of flow, plus what you think you need to achieve any level of HP at the injector.
The graphs are based on theoretical flow, with nothing being returned to the tank. Which in reality could never happen, or if it did start to approach it, could be bad for the engine.
The Bosch pumps steady and consistent flow at all pressures make it a superb all rounder, regardless of some others claiming more flow. The ones that do claim more, also draw huge amounts of current.
So you must have an excess of flow, plus what you think you need to achieve any level of HP at the injector.
The graphs are based on theoretical flow, with nothing being returned to the tank. Which in reality could never happen, or if it did start to approach it, could be bad for the engine.
The Bosch pumps steady and consistent flow at all pressures make it a superb all rounder, regardless of some others claiming more flow. The ones that do claim more, also draw huge amounts of current.
Thread Starter
I need a gauge for that
iTrader: (37)
Joined: Jan 2006
Posts: 10,921
Likes: 3
From: Huntsville, AL
Just wanted to bump this and say I have updated the spreadsheet to be more accurate, include e85, added more pumps, and added some quick calculators in there.
I have been using the original spread sheet that was posted a BUNCH for multiple different combos. I plugged in a bsfc of .83 for e85 and it seemed to be very close to accurate for me. Helped me pick my base fuel pressure a couple times now (started with a 255/450 combo then upgraded to 2 450's to get more out of the injectors). Thanks for posting this in the first place. I'll have to check out the new spreadsheet.

