


VE Table Cracked
TECH Addict
Joined: Oct 2003
Posts: 2,620
Likes: 0
From: Central, MA
Originally Posted by P Mack
No, it's not 5.7 liter specific. You can plug in any displacement you want. The 3444 is a combination of one intake stroke for every 2 revolutions (per cylinder), the gas constant for air (.287 kJ/kg K), 60 seconds per minute, and times 100 to make it a percent. The conversion from liters to cubic meters and from kilograms to grams cancel each other out. I can post the derivation if you really want.
Have you had any more time to use the VE you've come up with using the formula?

Teching In
Joined: Apr 2004
Posts: 17
Likes: 0
I am wondering why a formula is necessary at all and if it should even be relied upon. If your formula is correct, which I seriously doubt after numerous mods have been made, then it would follow that the degree each cell needs to be modified would be by a percent that the afr increases or decreases for each cell. So what does the formula do for me other than confuse me?

TECH Apprentice
Joined: Apr 2002
Posts: 308
Likes: 0
From: Austin, TX
Just an FYI, I wrote a quick program to read in log files and spit out a VE table based on the average readings.
I spit out one based on:
VE = g/sec * IAT / (MAP * RPM * Displacement)
IAT: Degrees Kelvin
MAP: Bar
Displacement: Cubic Meters
and another based on:
ve(non scaled) = (g/cyl*8122)/(Kpa*51.2) * (IAT*32)
ve scaled = ve(non scaled/5.12)
I scanned a friend�s stock (except catback) z06 and compared the output to a stock z06 table. The second method came up with some #s very close to the stock file. The first method seemed to produce values that were too high across the board. I may have had a bug in my code that threw off the first method, but I worked up a spreadsheet and had the same problem. Maybe I just screwed up the formula some how, but it seems off to me. Anyhoo, that is what I found so far.
A few quick data points:
5200rpms
95kpa
88* IAT
avg flow 259.68g/sec
first method calc:2819
second method calc:2398
pcm stock value:2420
3600rpms
75kpa
90*IAT
avg flow 129 g/sec
first method calc:2581
second method calc:2195
pcm stock value:2145
Nogo'sve% = MAF.gp/s*(IAC+273)/((346*RPM)*MAP)*212544
gameover's = Ve= g/cy * ((IAT+273)*5120)/MAP(kpa)/cyl colume/178
This will output the ve in percentages for use with HPTuners
gameover's = Ve= g/cy * ((IAT+273)*5120)/MAP(kpa)/cyl colume/178
This will output the ve in percentages for use with HPTuners
Could someone please send me an a tap log file (or excell spreadsheet)? I am 10 hours away from my car at school and my buddies and I are going to write a program that will make the calculations and put them into a spreadsheet form if we have time.
This will be greatly appreciated as I have no data to work with.
Thanks,
Conrad
This will be greatly appreciated as I have no data to work with.
Thanks,
Conrad
Originally Posted by FastBlackTA
So in HPTuners you can simply log the parameters and it will automztically spit out a VE table?
Yeah in the form of a histogram that displays LTRIM information in ve table format. The Trims are a dirrect correlation to how far from 14.7 your car has deviated from. Adjsuting the ve table by the LTRIM percentage will dial it in. Check around the forums and you will see a few of us are tuning this way with and without the MAF
LS1 Tech Stories
The Best V8 Stories One Small Block at Time

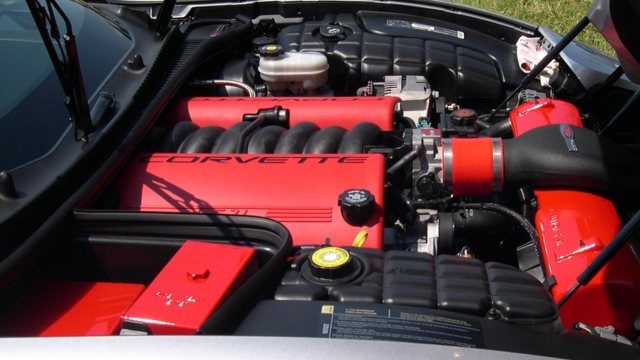
6 Common C5 Corvette Failures and What's Involved In Repairing Them
Pouria Savadkouei
Retro Modern Bandit Pontiac Trans AM Comes With Burt Reynolds' Autograph
Verdad Gallardo
Top 10 Greatest Cadillac V Series Performance Models Ever, Ranked
Pouria Savadkouei
Top 10 Most Powerful Chevy Trucks Ever Made!

Hennessey's New Supercharged Silverado ZR2 Has 700 HP
Verdad Gallardo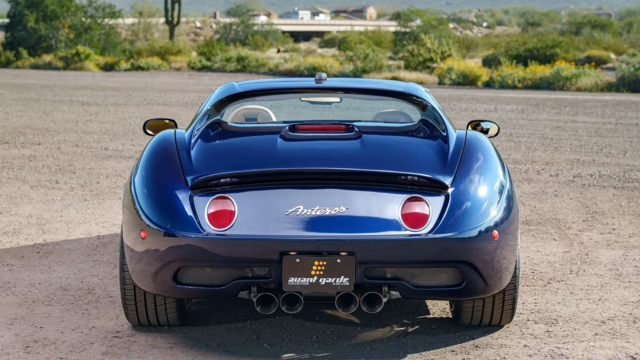
Coachbuilt N2A Anteros Is an LS2-Powered C6 Corvette In Italian Clothes
Verdad Gallardo
Awesome K5 Blazer Restomod Comes With C7 Corvette Power
Verdad Gallardo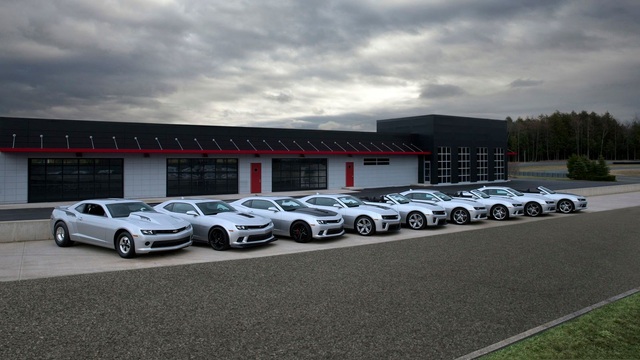
10 Camaros You Should Never Buy
10 LS Engine Myths That Refuse to Die
Verdad Gallardo Yeah Ive seen all that, but don't want to spend the $$$ for HPTuners right now esp since I can crank out program pretty fast.
If you had a log file that would be awsome.
Thanks,
Conrad
If you had a log file that would be awsome.
Thanks,
Conrad

TECH Regular
Joined: Apr 2003
Posts: 413
Likes: 0
From: Atlanta, GA
Originally Posted by FastBlackTA
Yeah Ive seen all that, but don't want to spend the $$$ for HPTuners right now esp since I can crank out program pretty fast.
If you had a log file that would be awsome.
Thanks,
Conrad
If you had a log file that would be awsome.
Thanks,
Conrad
It not quite as easy as just applying the formulas to the data. Their are quite a few formulas and none of them 100% match our VE table all the way throughout the RPM band. I have developed software which I have been beta testing that does semi-accurately map the VE table but it applies many characteristics that I have calculated to match our curve accurately.
There is also data that is logged that does not need to be applied to the VE calculations/map depending on certain conditions.
You can see some screenshots of the VE MAP on my site in my sig.
Staging Lane
Joined: Aug 2002
Posts: 55
Likes: 0
From: Plano, Texas
Originally Posted by NoGo
I have been working on the VE table quite a bit lately and I think I found the solution.
Thanks to gameover for some key hints.
The VE table looks as though it is in meters cubed, it is just not used like a conventional VE table. The VE values are such that the PCM can directly backcalculate to g/cyl, the primary means to determine fueling and timing.
This is what makes it so confusing. You can't solve for air mass, you have to solve for g/cyl.
Anyhoo, here is the equation
VE = ((massflow * IAT / (MAP * RPM * Displacement))
Massflow: grams/sec
IAT: Degrees Kelvin
MAP: Bar
RPM: Duh!
Displacement: Cubic Meters
To solve for the massflow in g/sec simply re-arrange the equation.
Massflow = (VE * MAP * RPM * Displacement) / IAT
My old method of "Divide by 30" works okay because we are inadvertantly solving for a volume ratio. The molar mass of air is 28.96 g/mol.
I have compared the above equation to every bit of data that I have ever collected for a stock car, and the data matches up perfectly.
Any corrections, comments, or blinding errors please let me know.
Thanks,
Kevin
Someone posted "5.7L = 0.708", but that's not 5.7/8?

Staging Lane
Joined: Aug 2002
Posts: 55
Likes: 0
From: Plano, Texas
IAT: Degrees Kelvin
MAP: Bar
MAP: Bar
Last edited by TooManyIDs; Nov 23, 2004 at 07:50 AM.

Originally Posted by P Mack
No, it's not 5.7 liter specific. You can plug in any displacement you want. The 3444 is a combination of one intake stroke for every 2 revolutions (per cylinder), the gas constant for air (.287 kJ/kg K), 60 seconds per minute, and times 100 to make it a percent. The conversion from liters to cubic meters and from kilograms to grams cancel each other out. I can post the derivation if you really want.
Thanks!!
The value for the density of air being used in this thread (or maybe the other VE thread) is for dry air at sea level. Is elevation, barometric pressure, and humidity ignored? This can be calculated so one could assume average values such as 1,000 feet above sea level, barometric pressure 100 kilopascal, etc.
I just ordered HPTuners. I got a lot of catching up to do!
I just ordered HPTuners. I got a lot of catching up to do!
Originally Posted by HumpinSS
when the car is started the PCM takes a barometric reading. This shouldnt change as long as you arent traveling up and down the moutainsides....
 Same thing for fuel density I guess? It will vary as well. A/F ratio will vary based on gasoline profile ie oxygenates, alcohol, etc.