When you click on links to various merchants on this site and make a purchase, this can result in this site earning a commission. Affiliate programs and affiliations include, but are not limited to, the eBay Partner Network.
Assuming no detonation and that timing isn�t too advanced can we assume tq is a good representation of load on the rods, pistons, head gaskets...?
if so and your looking to get the most out of a given set of parts would it make sense to add boost in the upper rpms to maintain tq? Keep tq flat right up to your redline.
another way to ask the question is you have your typical tq curve and a flat boost curve and you want more power. Is it safer to add some boost everywhere or add more boost but just up top to get a flat tq line? Below is a pic of a couple of runs. Different boost levels so they are not comparable but the blue run shows what I am asking about. What if I let the boost creep up on the red run to hold tq at the peek level rather than letting it taper off.
Why let torque taper off at all? Why not just keep raising boost/torque right up to the red line?
that is the question I am asking. Would adding boost to maintain tq to redline make you faster without adding any additional load to key components like the rods, pistons, head gaskets, transmission...
There�s less load on the engine at higher rpms. Torque pushes the load, horsepower keeps it moving. It�s essentially the same thing just depends where it�s at in the rpm range. If you�ve got boost to add and parts to handle it, do it. If you monitored Gs you�d see at some point you�re out of power (Max boost/rpms) and the G trace would start to drop off. The main objective in tuning to be fast is to maintain the highest G possible for as long as you can.
There�s less load on the engine at higher rpms. Torque pushes the load, horsepower keeps it moving. It�s essentially the same thing just depends where it�s at in the rpm range. If you�ve got boost to add and parts to handle it, do it. If you monitored Gs you�d see at some point you�re out of power (Max boost/rpms) and the G trace would start to drop off. The main objective in tuning to be fast is to maintain the highest G possible for as long as you can.
500 lb-ft at 2500 is more load on the engine than 500 lb-ft at 6500? What do you mean by load? An engine that can handle the stress of 500 lb-ft is going to last longer running at a constant 2500 rpm than 6500 rpm at the same 500 lb-ft of torque. IMHO. LOL. Prove me wrong.
Increasing boost to maintain peak tq will make you faster. Look at a blower tq curve and see it actually increase with rpm. If the rotating assembly and head seal is up to your desired tq level, just need fuel and tune to avoid detonation. Tq twist stuff, that's why higher rpm and the resulting hp is typically more desirable.
Sounds like a centrifugal blower. Max rpm=max boost.....otherwise its just intentional boost creep lol. Always have the option to pin the wastegate shut and see what happens
500 lb-ft at 2500 is more load on the engine than 500 lb-ft at 6500?
If peak torque is at 2500 rpms, then yes. Peak torque is where the highest cylinder pressures are. In a very generic explanation, the engine is doing the most work to get spun up at that point.
An engine that can handle the stress of 500 lb-ft is going to last longer running at a constant 2500 rpm than 6500 rpm at the same 500 lb-ft of torque. IMHO. LOL. Prove me wrong.
You say �IMHO� then ask to prove you wrong! Let that sink in for a minute. Your opinion is your opinion. Do what you want. Gear your ride to run at 2500 rpms as your peak rpms and it should last forever. It�ll be slow as ****, but it�ll last.
Relax. I was trying to take the edge off my comment. I also was not talking about peak torque. I was responding to this comment. "There’s less load on the engine at higher rpms." That could be true if peak torque is below what you are calling higher rpms. As far as your comment "Gear your ride to run at 2500 rpms as your peak rpms and it should last forever. It’ll be slow as ****, but it’ll last." goes:thanks for missing the point As far as your comment :"Torque pushes the load, horsepower keeps it moving." WTF?
As boost is increased, the BMEP increases, adding more component load.
As for load differences at various rpms, the inertial load increases with the square of the rpm increase.
IE: 6000 vs 7200, the load increases by 144%.
I posted this here then took it down, but now feel like it's relevant.
Someone wrote their master's thesis on the design of a FSAE engine from scratch. He mathematically modeled the entire engine. This is a single cylinder and has the load from RPM modeled, in addition with the load from combustion for various RPM's. I thought this may be interesting.
This equation shows the inertial loads
Looks like the square Old Geezer is referring to is the omega (angular acceleration relating to RPM).
If anyone wants to read it I can add the paper. It's really interesting and fairly easy to understand with useful graphs, and figures
Anyhoo, in case the dead horse hasn't been beat to death, if you take the torque from added boost and push it up high in the RPM the engine sees a lot more load
Anyhoo, in case the dead horse hasn't been beat to death, if you take the torque from added boost and push it up high in the RPM the engine sees a lot more load
this hasn�t been beaten I death, in fact most people are saying just the opposite. I will dig into that link and try and get some decent questions to ask.
I wasn't sure how to upload a pdf so here is a google drive link. Pretty sure I made it so that anyone with the link can view it. I believe I originally found the file by looking up engine balancing on google scholars
Edit: Most the interesting stuff I found was around pages 80 to 90 ish. It goes over the piston speeds and piston loads of different rod length and crank offset and all sort of odd instances. Very interesting
Edit 2: Looks like the combustion force works opposite of tension force from reciprocating mass. FYI don't take what I say seriously. Didn't write the paper and not a internal combustion engine engineer
Last edited by Woodylyf767; Apr 24, 2021 at 07:33 PM.
Here is an example of what I am talking about. The blue has a flat boost curve with tq of 728. The red has a rising boost curve with rpm but with a lower peek tq of 712.
in both cases the car will shift at ~7500rpm and probably fall back to about 6400.
if peek rpm stays the same and peek tq is less does the red graph actually stress the motor less?
If the reasoning is to max an existing improperly matched combo, then I suppose ramping up boost to redline could be of benefit. If the reasoning is to use a high rpm/high boost capable setup with a torque limited powertrain, again I see a benefit. If you were speccing a build, I cannot imagine why you would intentionally do this. The reasoning is sort of like feature creep with software. If you could only spin a little higher, you would have more power. If you could only make more boost/torque, you would make more power. There is a reason people finally stop. Something eventually can't keep up. If the possibility of ramping up torque all the way to redline is ever on the table, it is because some other part is reaching a hard limit. Otherwise, you would just spin it higher for more power.
Quote "if peek rpm stays the same and peek tq is less does the red graph actually stress the motor less?"
Not sure what you're asking. Is the "red graph" referring to hp curve? Cylinder pressure depicted in tq curve indicates level of compressive stress. RPM relates to inertial stress. The graph shows increased boost is applied at pk hp (~6750) which increases the hp to a new peak of 7300.
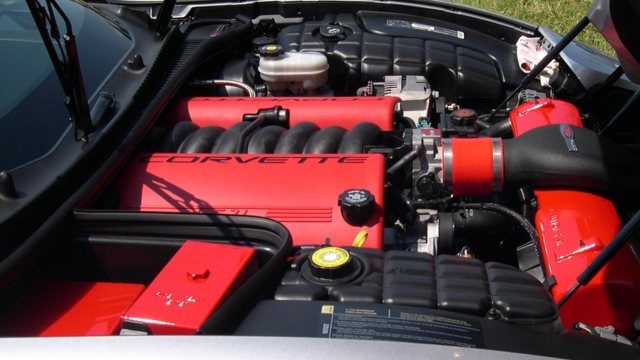
6 Common C5 Corvette Failures and What's Involved In Repairing Them
Slideshow: From wobbling harmonic balancers to failed EBCMs, these are the issues that define long-term C5 ownership and what repairs typically involve.
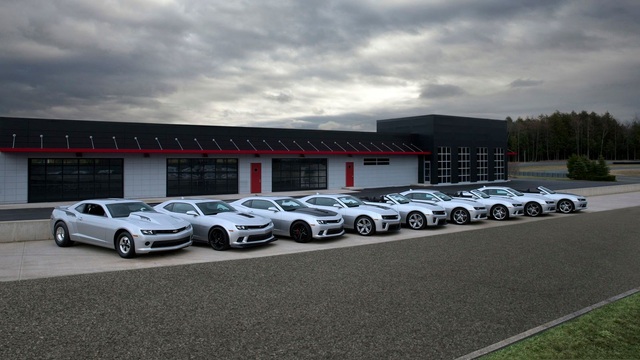
Retro Modern Bandit Pontiac Trans AM Comes With Burt Reynolds' Autograph
Slideshow: A modern Camaro transformed into a retro icon, this limited-run "Bandit" build blends nostalgia with brute force in a way few revivals manage.
Top 10 Greatest Cadillac V Series Performance Models Ever, Ranked
Slideshow: Cadillac didn't just crash the high-performance luxury vehicle party, it showed up loud, supercharged, and occasionally a little unhinged...
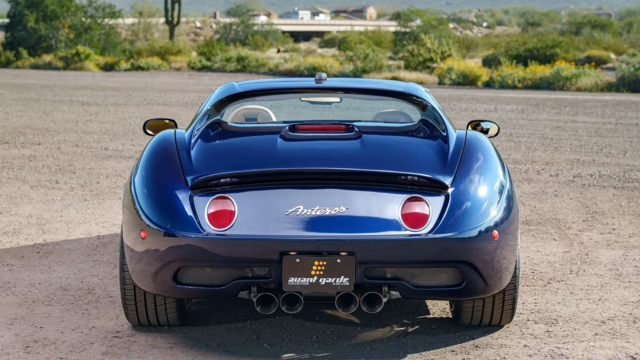
Coachbuilt N2A Anteros Is an LS2-Powered C6 Corvette In Italian Clothes
Slideshow: A one-off sports car that looks like a vintage Italian exotic-but hides a C6 Corvette underneath-just sold for the price of a new mid-engine Corvette.