


precision 76gts?????

Staging Lane
Joined: Oct 2005
Posts: 73
Likes: 0
Originally Posted by JZ 97 SS 1500
Read SAE J1826 standards, then come back....it will explain alot, if you need a copy let us know. My question to you is, how do you flow a compressor wheel without a turbine wheel? You going to spin it at the end of your finger  .
.
Yes compressor cover A/R's change the flow output, turbine wheel design, and turbine housing size is also a factor.
Jose
Yes compressor cover A/R's change the flow output, turbine wheel design, and turbine housing size is also a factor.
Jose
Yeah, because they make the COMPRESSOR maps while the turbo is on the car.

If the turbine wheel had anything to do with a compressor map, it would not be called a compressor map. I have never seen any documentation saying that Garrett tests their turbo's to SAE standards and have been told the contrary by a Honeywell engineer. They spin the turbine side of the shaft with an electric motor, not their finger. That way they can control the RPM exactly and give you the nice little map. They don't even have a turbine wheel hooked up while they do it, so how can it have any effect on the map?
Ever seen a Garrett compressor map that made any reference to the turbine side of the turbo? I never have. They do tell you the wheel and compressor housing it is in though.

TECH Addict
Joined: Jul 2005
Posts: 2,153
Likes: 3
Originally Posted by eviltwins
What fills up a baloon faster, a bicycle pump with a 4" bore and a 4" stroke, or a 3.9" bore and a 3.6" stroke? The bigger pump is moving a lot more air out of itself, and means that if you're both going the same number of strokes per minute, you're going to overflow and pop the balloon a lot quicker.
Originally Posted by eviltwins
Same goes for a turbo motor. I've seen with my own eyes a 5:1 backpressure to boost pressure ratio on a .96 A/R Q-trim T76 on a buddies 408" motor. This thing was a 9:1 SCR motor that was knocking with barely any timing on 10 pounds of boost and a roughly 100 octane mix of pump and race gas. Even with a 1.30 A/R exhaust housing we were only able to squeek 690 RWHP out of that turbo with the wastegate SHUT. We actually blew header gaskets regularly with this car. This EXACT turbo with a .96 A/R housing made over 800 RWHP on my little 306 with a stick. When you can't move the air out of the exhaust it doesn't matter how efficient your compressor side is.
Originally Posted by eviltwins
I substitute your books for my real word experience.

Here is the schematics of a turbo test stand. SAE J1826....

Turbo test stand
Right click and save as.
Any other questions.... BTW, we have all the documentations for a reason. We are working to do compressor map testing for one of the large turbo companies. Anything else
Jose
Suspended Sponsor
Joined: Oct 2004
Posts: 371
Likes: 0
From: Just outside of Palm Springs Ca.
Originally Posted by JZ 97 SS 1500
Guess compressor maps are worthless then eh...lol?? What happens to the pressure ratios.....are we just going to neglect those?? Does the efficiency of the compressor itself not matter....lol. You are neglecting the essential part of the compressor wheel and that is efficient compression of air vs the outlet pressure. Also backpressure will play a role as well. You have to distribute it over the cylinders since its a counter force. Mike I believe you yourself elaborated on this at one point as well. And it also is a valid point.
I would love to see a big cube 400+ ci LS1 with T3/T4 turbos. It has been done....will make power, but at the sacrifice of huge exhaust backpressure (2.5 to 3:1). Kills power, glowing headers, reversion in cylinders, lifting heads...etc..etc.
Jose
I would love to see a big cube 400+ ci LS1 with T3/T4 turbos. It has been done....will make power, but at the sacrifice of huge exhaust backpressure (2.5 to 3:1). Kills power, glowing headers, reversion in cylinders, lifting heads...etc..etc.
Jose
-Bryan
Originally Posted by JZ 97 SS 1500
Here is the schematics of a turbo test stand. SAE J1826....
Turbo test stand
Right click and save as.
Any other questions.... BTW, we have all the documentations for a reason. We are working to do compressor map testing for one of the large turbo companies. Anything else
Jose
ha ha
good one Jose........................ Ok, here is a visual representation of some calculating I did yesterday.
The small blue dots represent 3500 rpms, the big blue dots represent 6000 rpms. The single green dot was a 346 at 6000 rpms. This represents my current motor. At 14 psi of boost I made 625 rwhp, if you look at the map I should be flowing roughly 66lbs/min. 67lbs/min * 10.5 = 703 HP which seems to be pretty close assuming a 12% drivetrain loss for a M6. 703 * 88% = 619 rwhp. Maps and calcs seem to work pretty good to me.
Each dot is a 5psi incriment upto 20 psi. The maps are used to get you in the ball park. The new wheels extending the maps to the right slightly further, ITS rates my 76 at a hair over 105lbs/min. Graphs assumed a 370 motor.

T76

T80
As you can see on the 76 map it's geting close to the choke line.
The small blue dots represent 3500 rpms, the big blue dots represent 6000 rpms. The single green dot was a 346 at 6000 rpms. This represents my current motor. At 14 psi of boost I made 625 rwhp, if you look at the map I should be flowing roughly 66lbs/min. 67lbs/min * 10.5 = 703 HP which seems to be pretty close assuming a 12% drivetrain loss for a M6. 703 * 88% = 619 rwhp. Maps and calcs seem to work pretty good to me.
Each dot is a 5psi incriment upto 20 psi. The maps are used to get you in the ball park. The new wheels extending the maps to the right slightly further, ITS rates my 76 at a hair over 105lbs/min. Graphs assumed a 370 motor.
T76
T80
As you can see on the 76 map it's geting close to the choke line.
Last edited by Zombie; Oct 6, 2005 at 10:43 AM.
Originally Posted by Race-Prep
Everything I have read states that a compressor map is for estimation purposes, not a definative absoulte reference. I also have seen my share of turbos go well beyond their designed capability, I am simply saying they will do more than the compressor maps say they can. Just because it gets a little inefficient doesn't mean it can't keep going beyond optimum. I understand what your point is, but the reality of the matter is that a larger engine will simply make the power sooner. Obviously, if you put a T60 on a 454, it won't work very well and run out of steam at like 4000 RPM or less, but if it is close to what you need, like my GT76 on a 382, it will likely work fine and spool VERY fast if the proper A/R is used. I deal in AVERAGE power and it is what makes a vehicle FAST and in my opinion it makes more sense to trade a little peak high rpm power for a flatter power curve, it ALWAYS goes faster that way. This is just what I have seen in the last 12+ years of experience after graduating from SAM in the top 1% of my class and building everything from IRL engines to 800" big blocks making 2000+HP. Your point IS valid and I am not saying ignore the Map's but you need to admit it, you have seen it, the little fatory turbo on some car going WAY beyond its intended capability, making more power than it should. It may not be the optimum way to do it but it CAN be done.
-Bryan
-Bryan
LS1 Tech Stories
The Best V8 Stories One Small Block at Time

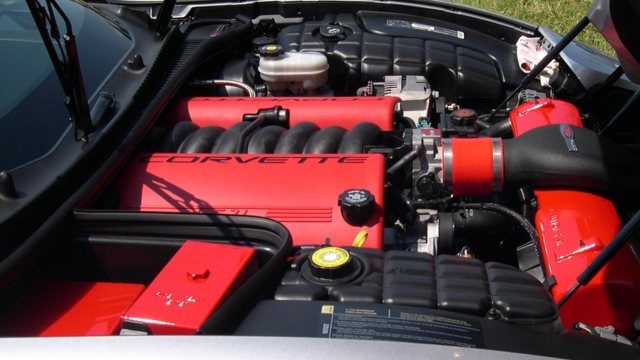
6 Common C5 Corvette Failures and What's Involved In Repairing Them
Pouria Savadkouei
Retro Modern Bandit Pontiac Trans AM Comes With Burt Reynolds' Autograph
Verdad Gallardo
Top 10 Greatest Cadillac V Series Performance Models Ever, Ranked
Pouria Savadkouei
Top 10 Most Powerful Chevy Trucks Ever Made!

Hennessey's New Supercharged Silverado ZR2 Has 700 HP
Verdad Gallardo
Coachbuilt N2A Anteros Is an LS2-Powered C6 Corvette In Italian Clothes
Verdad Gallardo
Awesome K5 Blazer Restomod Comes With C7 Corvette Power
Verdad Gallardo
10 Camaros You Should Never Buy
10 LS Engine Myths That Refuse to Die
Verdad Gallardo
TECH Apprentice
Joined: Jan 2004
Posts: 337
Likes: 0
From: Frisco TX (Dallas Area)
FWIW, I ran some numbers a couple of weeks ago on a 383 @ 90% VE.
I looked at low boost of 8 & 10 psi @ 3500, 5000, and 6500 rpm and plotted them on a T76 compressor map wanting something in the 750-800 chp range. Both showed that at 3500 the data points are in the most efficient (78%) range, at 5000 there is only a small drop to 70+%, but at 6500 its pretty close to the choke at an efficiency below 65%. So I'm thinking that the T76 would support 6000 RPM at 10 psi and make somewhere in the neighborhood of 720-750 hp out of a 383. The most efficient boost level (according to the map) appears to be at about 12 psi and looks like it would make about 800+hp on a 383.
What that says to me is that a T76/383 combination would make a very powerful street/strip setup with only a mild trade-off over 5500-6000 rpm. I would think that a 370 would be close to the same thing since it's only about 3% C.I. difference. And, oh yeah, it would need meth or an IC to get away with it on anything like 93 octane.
How does that fit with what Jose and Nate et. al. are saying?

TECH Regular
Joined: Nov 2001
Posts: 409
Likes: 0
Originally Posted by JZ 97 SS 1500
Jose
What do you mean when you say, higher pressure ratio? Do you mean more and /or cooler oxygen per cfm the unit pumps.
Last edited by Rpm2800; Oct 7, 2005 at 11:56 PM.
Originally Posted by Rpm2800
Jose, when you say that a turbo is out of it's efficiency range and less efficient pressure ratio , do you mean that it will basically start pushing "hot air" , (at least when the boost is raised too high). And...........
What do you mean when you say, higher pressure ratio? Do you mean more and /or cooler oxygen per cfm the unit pumps.
What do you mean when you say, higher pressure ratio? Do you mean more and /or cooler oxygen per cfm the unit pumps.
As for the PR. Its a representation of PSI(compressor output) vs Engine consumption. IF the PR ratio does not reach a certain level the compression of air from the compressor wheel starts to loose efficiency. Take a look at the compressor maps posted within this thread. You will see, if the engine consumption is high with relative low boost the turbo will start to blow hot air and reach the choke line. The opposite of that will take you to the surge line (diagonal line on compressor map). Which is the turbo outputs more then the engine can consume at a certain level.
Jose


Staging Lane
Joined: Oct 2005
Posts: 73
Likes: 0
Yes, the pressure ratio is just the atm of air going into the engine. That is the vertical axis on a compressor map. 14.7psi/atm is standard for sea level, but if anyone is at a high altitude, things can change quite a bit. For most people 14.7 is close enough though. Just something to keep in mind for the Denver guys.
TECH Addict
Joined: Jul 2005
Posts: 2,153
Likes: 3
Actually, let me correct myself. Pressure ratio is measured just upstream and just downstream of the compressor, so you have to correct for other losses by:
Pressure ratio = (Boost pressure + Pressure drop from turbo to intake + Pressure drop upstream of the compressor + 14.7)/14.7
Thos 2 corrections can make substantial changes to Pressure ratio. For instance, if you're running 20 psi boost, then:
Pressure ratio = (20 + 14.7)/14.7 = 2.36
However, if you're losing 1 psi upstream of the compressor and 3 psi downstream, then it becomes:
Pressure ratio = (20 + 3 + 1 + 14.7)/14.7 = 2.63