Extrapolated LS6 HP/TQ Curves, with Data

Thread Starter
Teching In
Joined: Jun 2018
Posts: 29
Likes: 1
From: Suburbs of Raleigh
Check it out, after calculated numbers, I produced the graph. 
Car was fast! Roaring around the streets of Charlotte.
I'm not sure I've seen anyone implement an extrapolated graph before.
From an incorrect thread start in the Dyno Results SubSection, it was concluded this is NOT a 'Dyno' result, sequentially, I'm moving the Scientific/Relevant Information here. Beware.
Now, based on the Graphing/Logging, it has multiple specific characteristics.
>> Negative Characteristics (Suggestions Welcome):
As far as running out of Inducted Air, with increased RPM's - one Vararam big MAF bigger TB 102 IM etc, should quell this just fine. Opinions?
Pretty darn good for what it is, with just hand tune. Very Fast!
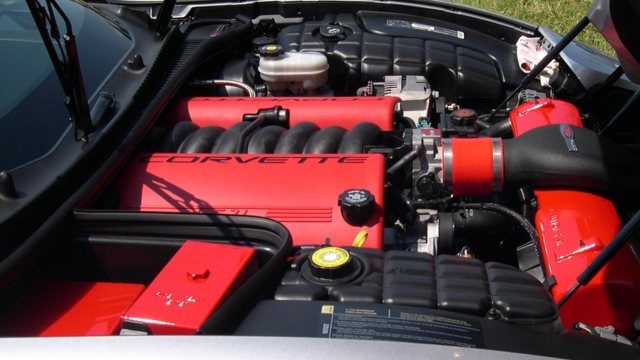
As far as real power, the Graph/Data reports 456 brake horse power, which seems optimistic for some induction with tune. Thoughts? I'm believing it could be 430 bhp without blinking an eye.
Car was fast! Roaring around the streets of Charlotte.
I'm not sure I've seen anyone implement an extrapolated graph before.
From an incorrect thread start in the Dyno Results SubSection, it was concluded this is NOT a 'Dyno' result, sequentially, I'm moving the Scientific/Relevant Information here. Beware.
Now, based on the Graphing/Logging, it has multiple specific characteristics.
>> Negative Characteristics (Suggestions Welcome):
- Constrictive intake track (because only minor bolton)
- Running out of / running spurt of an injector plot (Wtf)
- Much lower than ideal spark (never got around to this)
- IAT Temps soaring upon throttle (engine-bay heat-soak)
- MAF curve wavy like an ocean wave far from shore upon greater Revolutions (Heh)
- HP & TQ Curves look correct, for LS6
- Able to Derive Peaks of HP & TQ @ Specific RPM
- O2 sensor plot looks nice and smooth at just > 900
- Able to gauge 6000+ RPM Performance
- No Knock Retard present
- Good Street Load Test
As far as running out of Inducted Air, with increased RPM's - one Vararam big MAF bigger TB 102 IM etc, should quell this just fine. Opinions?
Pretty darn good for what it is, with just hand tune. Very Fast!
As far as real power, the Graph/Data reports 456 brake horse power, which seems optimistic for some induction with tune. Thoughts? I'm believing it could be 430 bhp without blinking an eye.