


Her's a New One: Mathmatically Constructing a VE/Spark Table
Thread Starter
TECH Enthusiast
iTrader: (1)
Joined: Dec 2005
Posts: 549
Likes: 0
From: Denver International Airport, Colorado USA
Has anybody successfully constructed a 'simple' software program to mathematically model a VE Table utilizing bore, stroke, cam and head profile?
Secondly, if that can be done, if you know your VE and also your cylinder pressures based on your cam and head configuration, could you aslo map out a reasonable spark curve?
No, I have done it (yet). Lack the specific software and engineering expertise to really do it, but it could really facilitate tuning knowledge.
While I have "Googled" the topic, I have not really ran across anything that has really popped out of me.
The reason I am curious is that while EFILive and HPTuner's are incredible tuning tools, I probably have spent 90% of my tuning time on these two area. And I have not been unsuccessful in finally getting there. But when you really analyze a lot of VE Tables, you can really start seeing a lot of interesting patterns in how the VE Tables shift as you increase overlap and cylinder pressures.
Hope this thread is not too advanced, but I know there are some really smart people on this forum.
Anybody thought the same thing, or came up with something? If you could add that concept in a tuning software program, not only could you save a lot of time, you would really have a superior marketing tool.
Hey, maybe I am thinking to much, but you have to admit, it is a different type of thread than 'how do I get my car to idle'.
Anybody got any thoughts?
..WeathermanShawn..
Thread Starter
TECH Enthusiast
iTrader: (1)
Joined: Dec 2005
Posts: 549
Likes: 0
From: Denver International Airport, Colorado USA
Yea, thats a great thread!
I will have to read through it again, but that is the general principle I am referring too.
I think I understand the airflow contributions as it pertains to the VE Table, just curious as to how far someone might have went as to use those concepts, and laid out a method to construct a VE Curve via spreadsheet or software.
I will re-read the thread. If the concept or answer is there, I apologize for my incomplete search.
..WeathermanShawn..
That would be a slick piece of software - and if it exists I bet it would be way beyond what my budget could afford  RHS has some cool utilities on his website, some of which I think can model a VE table based on injector flows
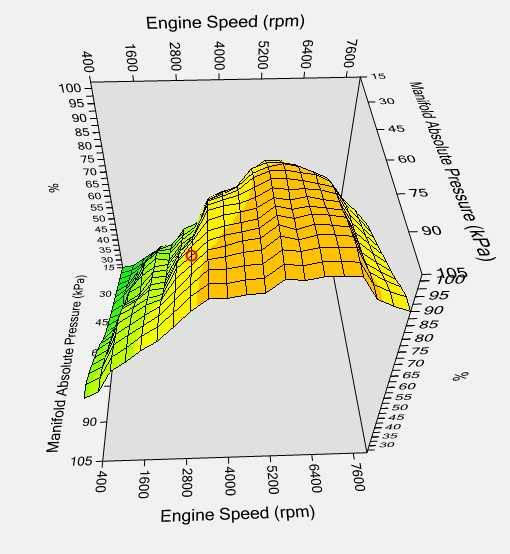
RHS has some cool utilities on his website, some of which I think can model a VE table based on injector flows i don't know how that could work. i've spent a great deal of time on my VE table (i run SD) and it's not a nice even ramp. certain RPM, more than likely due to resonance, make slight peaks and some are valleys. because all of the components, intake (including length and dia.), TB, manifold, heads and cam affect that differently there can't be one answer that fits all. here's my table showing the ridges during certain RPM. i've logged probably 75-100 logs with HPT and LC-1 to make this composite. it's very accurate for my engine.
Launching!

Joined: Jan 2002
Posts: 299
Likes: 41
From: Detroit, Murder City
You will NOT find a simple (excel based) solution for solving for VE based on engine components. It's just not that simple.
However, *IF* you have a MAF that is correctly calibrated, you can use that to solve for VE based on cylinder volume, RPM, MAP, and charge temperature. The problem here is that charge temp (entering the cylinder, not just at the IAT sensor) is difficult to measure at an absolute certainty, which introduces a bunch of error to the calculation. You will also potentially have skewed MAF readings within bands of resonance on the intake plumbing that can make for a noisy and inaccurate signal. This, of course, ASSumes that the MAF curve is absolutely right on as well.
VE maps should actually be rather smooth. They're based on AIR flow, not measured AFR. If you have issues with you transient fueling, chances are that you baked some of this assumed error into the VE surface to compensate. I see this a lot when people "tune" the VE by just driving around and logging. This is what often leads to the "peaks and valleys" seen in posted VE tables around here. You'll notice that GM tables are smooth, that's because the engine's actual pumping efficiency is a smooth function of speed and load. The variances in delivered AFR are usually because of fuel to wall interactions (wall film effect) more so than erratic VE changes.
At the end of the day, few shops (and even fewer individual enthusiasts) have the time, resources, knowledge, and equipment to really do this right. They usually get "close enough" and claim that their resulting tables are right because they get what they want in a single condition. As soon as the weather changes, they're retuning again. Coincidence?
Thread Starter
TECH Enthusiast
iTrader: (1)
Joined: Dec 2005
Posts: 549
Likes: 0
From: Denver International Airport, Colorado USA
Greg, that was some excellent insight. You reminded me VE is all about AIR, and using AFR to construct a VE table has it limitations and assumptions.
Like others I spent a lot of time constructing a new VE curve when adding heads and cam. Interestedly if I had just shifted the stock VE table 20-30 MAP's (to the right) and blended higher VE's at ~2800rpm's, it would have been real close.
By the way excellent book!
Appreciate all the replies.
..WeathermanShawn..
Trending Topics
LS1 Tech Stories
The Best V8 Stories One Small Block at Time

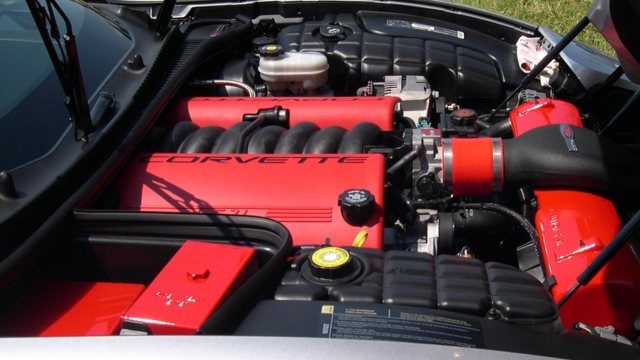
6 Common C5 Corvette Failures and What's Involved In Repairing Them
Pouria Savadkouei
Retro Modern Bandit Pontiac Trans AM Comes With Burt Reynolds' Autograph
Verdad Gallardo
Top 10 Greatest Cadillac V Series Performance Models Ever, Ranked
Pouria Savadkouei
Top 10 Most Powerful Chevy Trucks Ever Made!

Hennessey's New Supercharged Silverado ZR2 Has 700 HP
Verdad Gallardo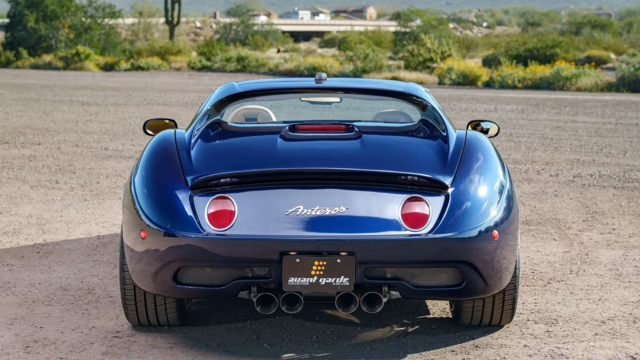
Coachbuilt N2A Anteros Is an LS2-Powered C6 Corvette In Italian Clothes
Verdad Gallardo
Awesome K5 Blazer Restomod Comes With C7 Corvette Power
Verdad Gallardo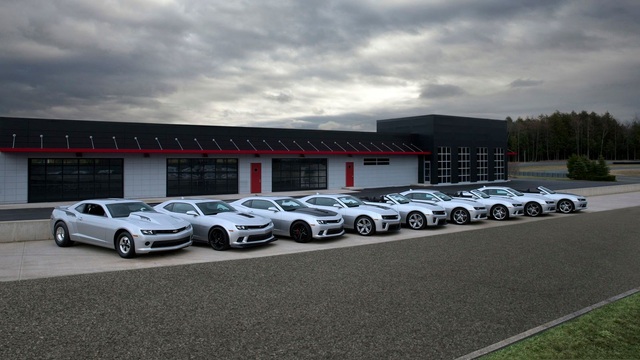
10 Camaros You Should Never Buy
10 LS Engine Myths That Refuse to Die
Verdad Gallardo i adjusted the curve on my Air Temp Bias table and using the above VE map it seems to be good in the range of ~30* to ~100* that i operate the car in. is there something that's wrong with that because the table is not iron board smooth? what else would you change? in SD if in a steady state RPM/MAP and the AFR is correct is there something else i should be looking for? BTW AFR error logs were the starting point of my tune. it was fine tuned by achieving as steady state as possible and analyzing histograms of that point
VE maps should actually be rather smooth. They're based on AIR flow, not measured AFR. If you have issues with you transient fueling, chances are that you baked some of this assumed error into the VE surface to compensate. I see this a lot when people "tune" the VE by just driving around and logging. This is what often leads to the "peaks and valleys" seen in posted VE tables around here. You'll notice that GM tables are smooth, that's because the engine's actual pumping efficiency is a smooth function of speed and load. The variances in delivered AFR are usually because of fuel to wall interactions (wall film effect) more so than erratic VE changes.
Hey Greg,
As always, thanks for the input. This begs the question though; if GM's smooth VE is a realistic model, why do the 100% stock cars have all types of excessive trimming (and in many places, inadequate or incorrect transient response) if you take them (the stock cars) off of the MAF and reference solely VE? We know about manufacturing variation but surely sooner or later we should have hit on one that was at least pretty close right?
I would like to know why there is such a strong MAP-axis slope
on VE tables when (you'd think) MAP is directly an input to the
calculation. Like nearly 2:1 VE from 20kPa to 100kPa, this says
the fundamental equation RPM*MAP*(273+IAT/273)*displacement
(or whatever) is nowhere near the truth.
I could see some density -> acoustics based deviation from intake
resonant effects but this MAP-axis fudgery seems to be regardless of
RPM (hence not much relation to resonance). And I'm still thinking
this wrongness has to do with fuel-surging (more MAP -> more fuel
-> suck wind -> more MAP).
I'm not at all optimistic about first-principles, or even a sophisticated
principles approach. It all seems like a "just fit the damn thing and
quit pretending it's science" situation to me.

Hey Greg,
As always, thanks for the input. This begs the question though; if GM's smooth VE is a realistic model, why do the 100% stock cars have all types of excessive trimming (and in many places, inadequate or incorrect transient response) if you take them (the stock cars) off of the MAF and reference solely VE? We know about manufacturing variation but surely sooner or later we should have hit on one that was at least pretty close right?
As always, thanks for the input. This begs the question though; if GM's smooth VE is a realistic model, why do the 100% stock cars have all types of excessive trimming (and in many places, inadequate or incorrect transient response) if you take them (the stock cars) off of the MAF and reference solely VE? We know about manufacturing variation but surely sooner or later we should have hit on one that was at least pretty close right?
Launching!
Joined: Jan 2002
Posts: 299
Likes: 41
From: Detroit, Murder City
I would like to know why there is such a strong MAP-axis slope
on VE tables when (you'd think) MAP is directly an input to the
calculation. Like nearly 2:1 VE from 20kPa to 100kPa, this says
the fundamental equation RPM*MAP*(273+IAT/273)*displacement
(or whatever) is nowhere near the truth.
on VE tables when (you'd think) MAP is directly an input to the
calculation. Like nearly 2:1 VE from 20kPa to 100kPa, this says
the fundamental equation RPM*MAP*(273+IAT/273)*displacement
(or whatever) is nowhere near the truth.
 The next book spends a whole chapter going from PV=nRT to the proper equation.
In short, increasing MAP has a pretty direct increase in cylinder filling. The ratio of this increase just varies with MAP and RPM.
I can assure you that there's actually real science being done there.
There's no such thing as "safely rich" at part throttle if we want to pass ULEV emissions standards. It just has to be right. Keep in mind that we have to account for a very wide range of stackups in components. For example, the individual fuel injectors can be +/-6% from the nominal. There's a TON of room for potential error, so our cal has to cover for that and have some method of bringing things in line even as the car ages.