Histogram for afr error %
I just installed long tubes, ory and exhaust. Already have a pretty good tune on it, so I just wanna see what my stft's are doing and adjust if needed.
So, I want to make a histogram for afr error %.
In my primary table I have:
AFR Error
Commanded EQ ratio
Mass Air Flow
AEM Wideband (input) Already verified readings match in HPT
Now for the Histogram Here's where I get lost...
I know I need to setup a histogram to plot the maf hz against the afr error, but I dont know how. I see Histogram # 1 is already setup for MAF- STFT. Do I need to modify the sensor or the filter below? Or should I be using #7 Histo VE-AFR error? I'll admit, I am lost. Been searching hpt and ls1tech for 2 days. I understand the theory, but dont know HOW to do it!
So, I want to make a histogram for afr error %.
In my primary table I have:
AFR Error
Commanded EQ ratio
Mass Air Flow
AEM Wideband (input) Already verified readings match in HPT
Now for the Histogram
Here's where I get lost...I know I need to setup a histogram to plot the maf hz against the afr error, but I dont know how. I see Histogram # 1 is already setup for MAF- STFT. Do I need to modify the sensor or the filter below? Or should I be using #7 Histo VE-AFR error? I'll admit, I am lost. Been searching hpt and ls1tech for 2 days. I understand the theory, but dont know HOW to do it!
Last edited by Justhereforinfo; Dec 28, 2015 at 12:23 PM.
Ok, I see the data populating now. I used histogram #7, which shows the afr error PID plotted against the primary VE vs MAP vs RPM.
I didnt know it wanted to see MAP and RPM. They werent in the primary table.
But I dont think this is the data I need, or its not in the right format.
I was expecting to see a value that I could input into my VE table using multiply %. Or is it right...?
I've attached my config,tune and log. What is the other file you need to see?
TECH Addict


Joined: Aug 2005
Posts: 2,305
Likes: 126
From: Monroe,NY
That should be the percent that is gathering in table 7. Do a test and multiply that table to your ve table and you will see the changes. All the negative # shows it is running rich. I would also put actual afr in your table so you can see the difference.
I like this link http://www.hptuners.com/forum/showth...nd-through-EGR
I like this link http://www.hptuners.com/forum/showth...nd-through-EGR
I never turned off the stft, so I'm pretty sure the data collected here is no good. It really doesnt matter anyway, because I'm pretty sure I have either an exhaust leak next to my narrow band, or the narrow bands were damaged when they welded my v bands in.
Can you see my O2 Sensor Voltage, and does it appear normal? I thought it was supposed to bounce back and forth from 0-900mv 30 times per minute or so...
I just had a shop remove the slip fit connector on both of my long tube headers, and weld in v band clamps. The weld is right next to my o2 sensors. Truck ran fine on the way to the shop, and ran like crap on the way home.
I have a new set of o2s coming in the mail tomorrow. Ill throw them in and scan again.
Trending Topics
LS1 Tech Stories
The Best V8 Stories One Small Block at Time

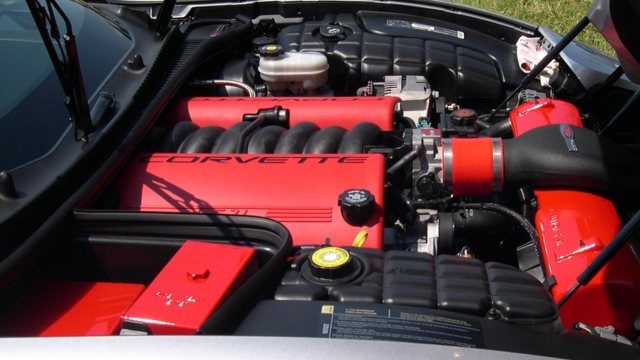
6 Common C5 Corvette Failures and What's Involved In Repairing Them
Pouria Savadkouei
Retro Modern Bandit Pontiac Trans AM Comes With Burt Reynolds' Autograph
Verdad Gallardo
Top 10 Greatest Cadillac V Series Performance Models Ever, Ranked
Pouria Savadkouei
Top 10 Most Powerful Chevy Trucks Ever Made!

Hennessey's New Supercharged Silverado ZR2 Has 700 HP
Verdad Gallardo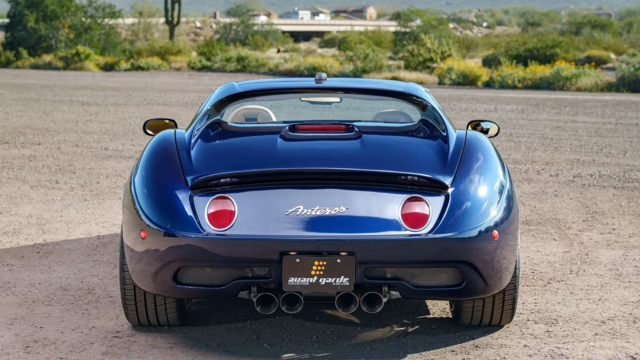
Coachbuilt N2A Anteros Is an LS2-Powered C6 Corvette In Italian Clothes
Verdad Gallardo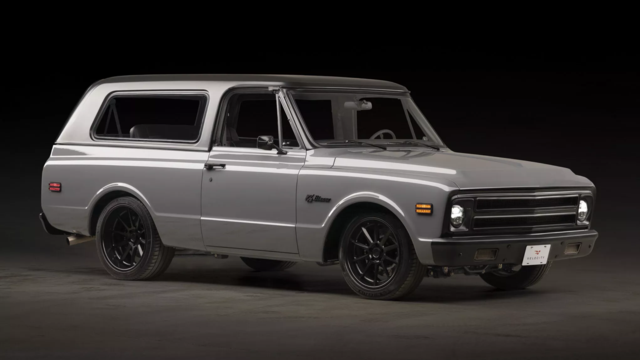
Awesome K5 Blazer Restomod Comes With C7 Corvette Power
Verdad Gallardo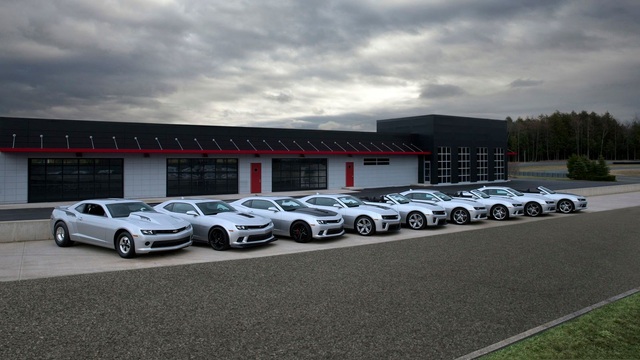
10 Camaros You Should Never Buy