Is there a formula to calculate ignition timing
 10-04-2006, 11:16 AM
#1

Is there a formula to calculate ignition timing? I thought I had seen something where you calculate RPM, spark plug distance to center of chamber, comrpession ratio, ect. and it gives you an starting timing advance.
Phil
Phil
 10-05-2006, 01:52 PM
#2
6600 rpm clutch dump of death Administrator

Not just a simple formula. If you want to get really fancy thought, you can get a pressure transducer that measure the pressure wace vs crankshaft rotation vs A/F ratio, etc... and can help you map out your spark.
One thread on timing.
https://ls1tech.com/forums/advanced-engineering-tech/254868-ignition-timing-101-a.html
One thread on timing.
https://ls1tech.com/forums/advanced-engineering-tech/254868-ignition-timing-101-a.html
10-05-2006, 01:54 PM
#3
6600 rpm clutch dump of death Administrator
Here is what I have in formulas...
https://ls1tech.com/forums/advanced-engineering-tech/178880-post-up-any-car-math-formulas-you-may-have.html
https://ls1tech.com/forums/advanced-engineering-tech/178880-post-up-any-car-math-formulas-you-may-have.html
10-05-2006, 02:45 PM
#4
On The Tree

Join Date: Mar 2006
Posts: 144
Likes: 0
Received 0 Likes
on
0 Posts
I have been messing around with ignition timing for some time with my Meqasquirt II on my sbc.
there is a nice excel fill here somewhere:
http://msefi.com/viewtopic.php?t=9941
(might have to be a member to view it)
tons more info here:
meqasquirt.info
I tired to attach the excel program, it won't let me attach .xls, any one know what I need to convert it too? I tried making it a .txt but when I opened it in excel all the formulas were gone
10-09-2006, 09:17 AM
#5
6600 rpm clutch dump of death Administrator
They are taking a wild guess at base timing, and then applying certain modifiers based on MAP data and RPM. Its obviously much better than just plugging numbers in, but you are making certain assumptions to start with.
Again, with that said, it is much better than nothing.
Now, if you want to get really tricky and you want to map your ignition directly to YOUR combination.
http://www.tfxengine.com/
Features
Record engine HP and torque for each individual cylinder, during each run down the dragstrip
Display variations in HP and torque from one cylinder to the next
Display variations in HP and torque from one combustion cycle to the next
Record cylinder filling (volumetric efficiency) for each cylinder
Record combustion pressures for each cylinder and the location relative to TDC
Record the rate of air/fuel mixture combustion (mass fraction burned) for each cylinder and every combustion cycle
Detect detonation on as few as 1 in 100 combustion cycles
Display detonation magnitude and pinging frequency for each cycle with detonation
Record pressures in the intake/exhaust ports during valve overlap
Record pressure in the intake port at intake valve closing
Evaluate differences in combustion properties between fuels of different brands/octane ratings
Hardware
Data logging up to 1.8 million samples per second
Compact, lightweight, rugged, easy to assemble/disassemble
Metal military quick disconnects and braided stainless shielding
In-Car Systems (ICS) now accept up to 8 pressure sensors, crank sensor, numerous digital inputs
Dyno Based Systems (DBS) now accept up to 10 pressure sensors, plus crank sensor
DBS units connect to both desktop and laptop computers using USB ports
DBS units can be used for in-car applications where a laptop computer can be installed in the vehicle
Low Cost Systems (LCS) allow engine pressure analysis technology to be used by raceteams operating on a tight budget
Software
Over 20 data plot formats including:
HP, torque, IMEP vs. rpm and time
combustion pressure vs. piston position
detonation intensity
air-fuel mixture burn rates vs. piston position
combustion efficiency
volumetric efficiency vs. rpm and time
port pressures during valve overlap
intake port pressure vs. piston position
exhaust port pressure vs. piston position
exhaust stroke back-pressure
individual cycle and overall data summary
plots of multiple cylinders overlayed
Data is displayed for each and every combustion event as well as in a series of overall test summary formats.
Energy Release Graph
Some of the biggest power gains can be made by looking at the energy release graph. This graph indicates when combustion starts, how fast the mixture burns and when combustion finishes relative to piston position. It should be noted that the crankshaft rotates several degrees between the time the spark occurs and the time when any measurable increase in pressure occurs in the cylinder.
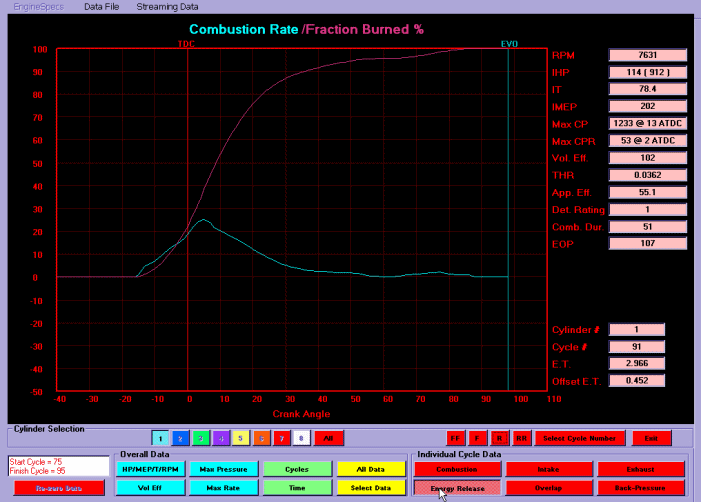
Energy Release
The pink curve shows shows how much of the mixture has combusted (left side scale in %) relative to crank position in degrees (bottom scale). In this example combustion starts at 16 BTDC. By the time the piston reaches TDC, 22% of the mixture is combusted. 75% of the mixture is combusted by 20 ATDC and combustion is completed by 85 ATDC. The blue curve shows that combustion is occurring at the quickest rate at about 5 ATDC.
Significant power gains are made by burning the entire air/fuel mixture as quickly as possible and by positioning the combustion process appropriately around TDC. Almost every engine modification has an effect on the burn rate, but without using a pressure analyzer it is impossible to know how the burn rate is affected. Many fast-burn combustion chambers allow the tuner to reduce the ignition timing, suggesting that the burn rate is improved, but in most cases only the first 50% of the mixture burns more quickly, not the entire mixture.
Although the big block engine in the energy release graph above is making 896 HP at 7454 rpm, a 10% increase in power is a realistic goal simply by getting the last 20% of the mixture to burn more quickly. Many tuners strive for a 1% increase in power thinking that there may only ever be 2 or 3% more power available. Our pressure analyzers show the tuner where to look for more power and how much more power is realistically achievable.
Again, with that said, it is much better than nothing.
Now, if you want to get really tricky and you want to map your ignition directly to YOUR combination.
http://www.tfxengine.com/
Features
Record engine HP and torque for each individual cylinder, during each run down the dragstrip
Display variations in HP and torque from one cylinder to the next
Display variations in HP and torque from one combustion cycle to the next
Record cylinder filling (volumetric efficiency) for each cylinder
Record combustion pressures for each cylinder and the location relative to TDC
Record the rate of air/fuel mixture combustion (mass fraction burned) for each cylinder and every combustion cycle
Detect detonation on as few as 1 in 100 combustion cycles
Display detonation magnitude and pinging frequency for each cycle with detonation
Record pressures in the intake/exhaust ports during valve overlap
Record pressure in the intake port at intake valve closing
Evaluate differences in combustion properties between fuels of different brands/octane ratings
Hardware
Data logging up to 1.8 million samples per second
Compact, lightweight, rugged, easy to assemble/disassemble
Metal military quick disconnects and braided stainless shielding
In-Car Systems (ICS) now accept up to 8 pressure sensors, crank sensor, numerous digital inputs
Dyno Based Systems (DBS) now accept up to 10 pressure sensors, plus crank sensor
DBS units connect to both desktop and laptop computers using USB ports
DBS units can be used for in-car applications where a laptop computer can be installed in the vehicle
Low Cost Systems (LCS) allow engine pressure analysis technology to be used by raceteams operating on a tight budget
Software
Over 20 data plot formats including:
HP, torque, IMEP vs. rpm and time
combustion pressure vs. piston position
detonation intensity
air-fuel mixture burn rates vs. piston position
combustion efficiency
volumetric efficiency vs. rpm and time
port pressures during valve overlap
intake port pressure vs. piston position
exhaust port pressure vs. piston position
exhaust stroke back-pressure
individual cycle and overall data summary
plots of multiple cylinders overlayed
Data is displayed for each and every combustion event as well as in a series of overall test summary formats.
Energy Release Graph
Some of the biggest power gains can be made by looking at the energy release graph. This graph indicates when combustion starts, how fast the mixture burns and when combustion finishes relative to piston position. It should be noted that the crankshaft rotates several degrees between the time the spark occurs and the time when any measurable increase in pressure occurs in the cylinder.
Energy Release
The pink curve shows shows how much of the mixture has combusted (left side scale in %) relative to crank position in degrees (bottom scale). In this example combustion starts at 16 BTDC. By the time the piston reaches TDC, 22% of the mixture is combusted. 75% of the mixture is combusted by 20 ATDC and combustion is completed by 85 ATDC. The blue curve shows that combustion is occurring at the quickest rate at about 5 ATDC.
Significant power gains are made by burning the entire air/fuel mixture as quickly as possible and by positioning the combustion process appropriately around TDC. Almost every engine modification has an effect on the burn rate, but without using a pressure analyzer it is impossible to know how the burn rate is affected. Many fast-burn combustion chambers allow the tuner to reduce the ignition timing, suggesting that the burn rate is improved, but in most cases only the first 50% of the mixture burns more quickly, not the entire mixture.
Although the big block engine in the energy release graph above is making 896 HP at 7454 rpm, a 10% increase in power is a realistic goal simply by getting the last 20% of the mixture to burn more quickly. Many tuners strive for a 1% increase in power thinking that there may only ever be 2 or 3% more power available. Our pressure analyzers show the tuner where to look for more power and how much more power is realistically achievable.
 10-09-2006, 05:17 PM
#7

Originally Posted by Phil99vette
Is there a formula to calculate ignition timing? I thought I had seen something where you calculate RPM, spark plug distance to center of chamber, comrpession ratio, ect. and it gives you an starting timing advance.
Phil
Phil
Last edited by LSPerformance; 10-09-2006 at 05:28 PM.
Trending Topics
10-10-2006, 10:00 PM
#8
I have been holding out on modifying my spark maps because I don't really have a procedure to follow. I was thinking about getting a live tuner and just holding the motor at a condition. Then moving the timing back and forth time I find the sweet spot. Back it off a little from that.
This is a very interesting thread.
This is a very interesting thread.